The 2026 Election Playbook
It’s midterm season, and the stakes couldn’t be higher. If Democrats can win control of Congress, they can stop our nation’s slide toward fascism.
The path to winning relies on the multiracial New American Majority. This playbook highlights the districts and states Democrats can win, and the grassroots organizations on the ground that need your support right now.
There’s no shortage of midterm forecasts and similar reports tracking the most competitive districts. What makes ours different? Ours is the only one that factors in race. We crunch the electoral data and overlay race and demographics as key metrics for understanding the electorate. That matters because race remains strongly associated with voting patterns in U.S. elections.
Why 2026 Is Winnable
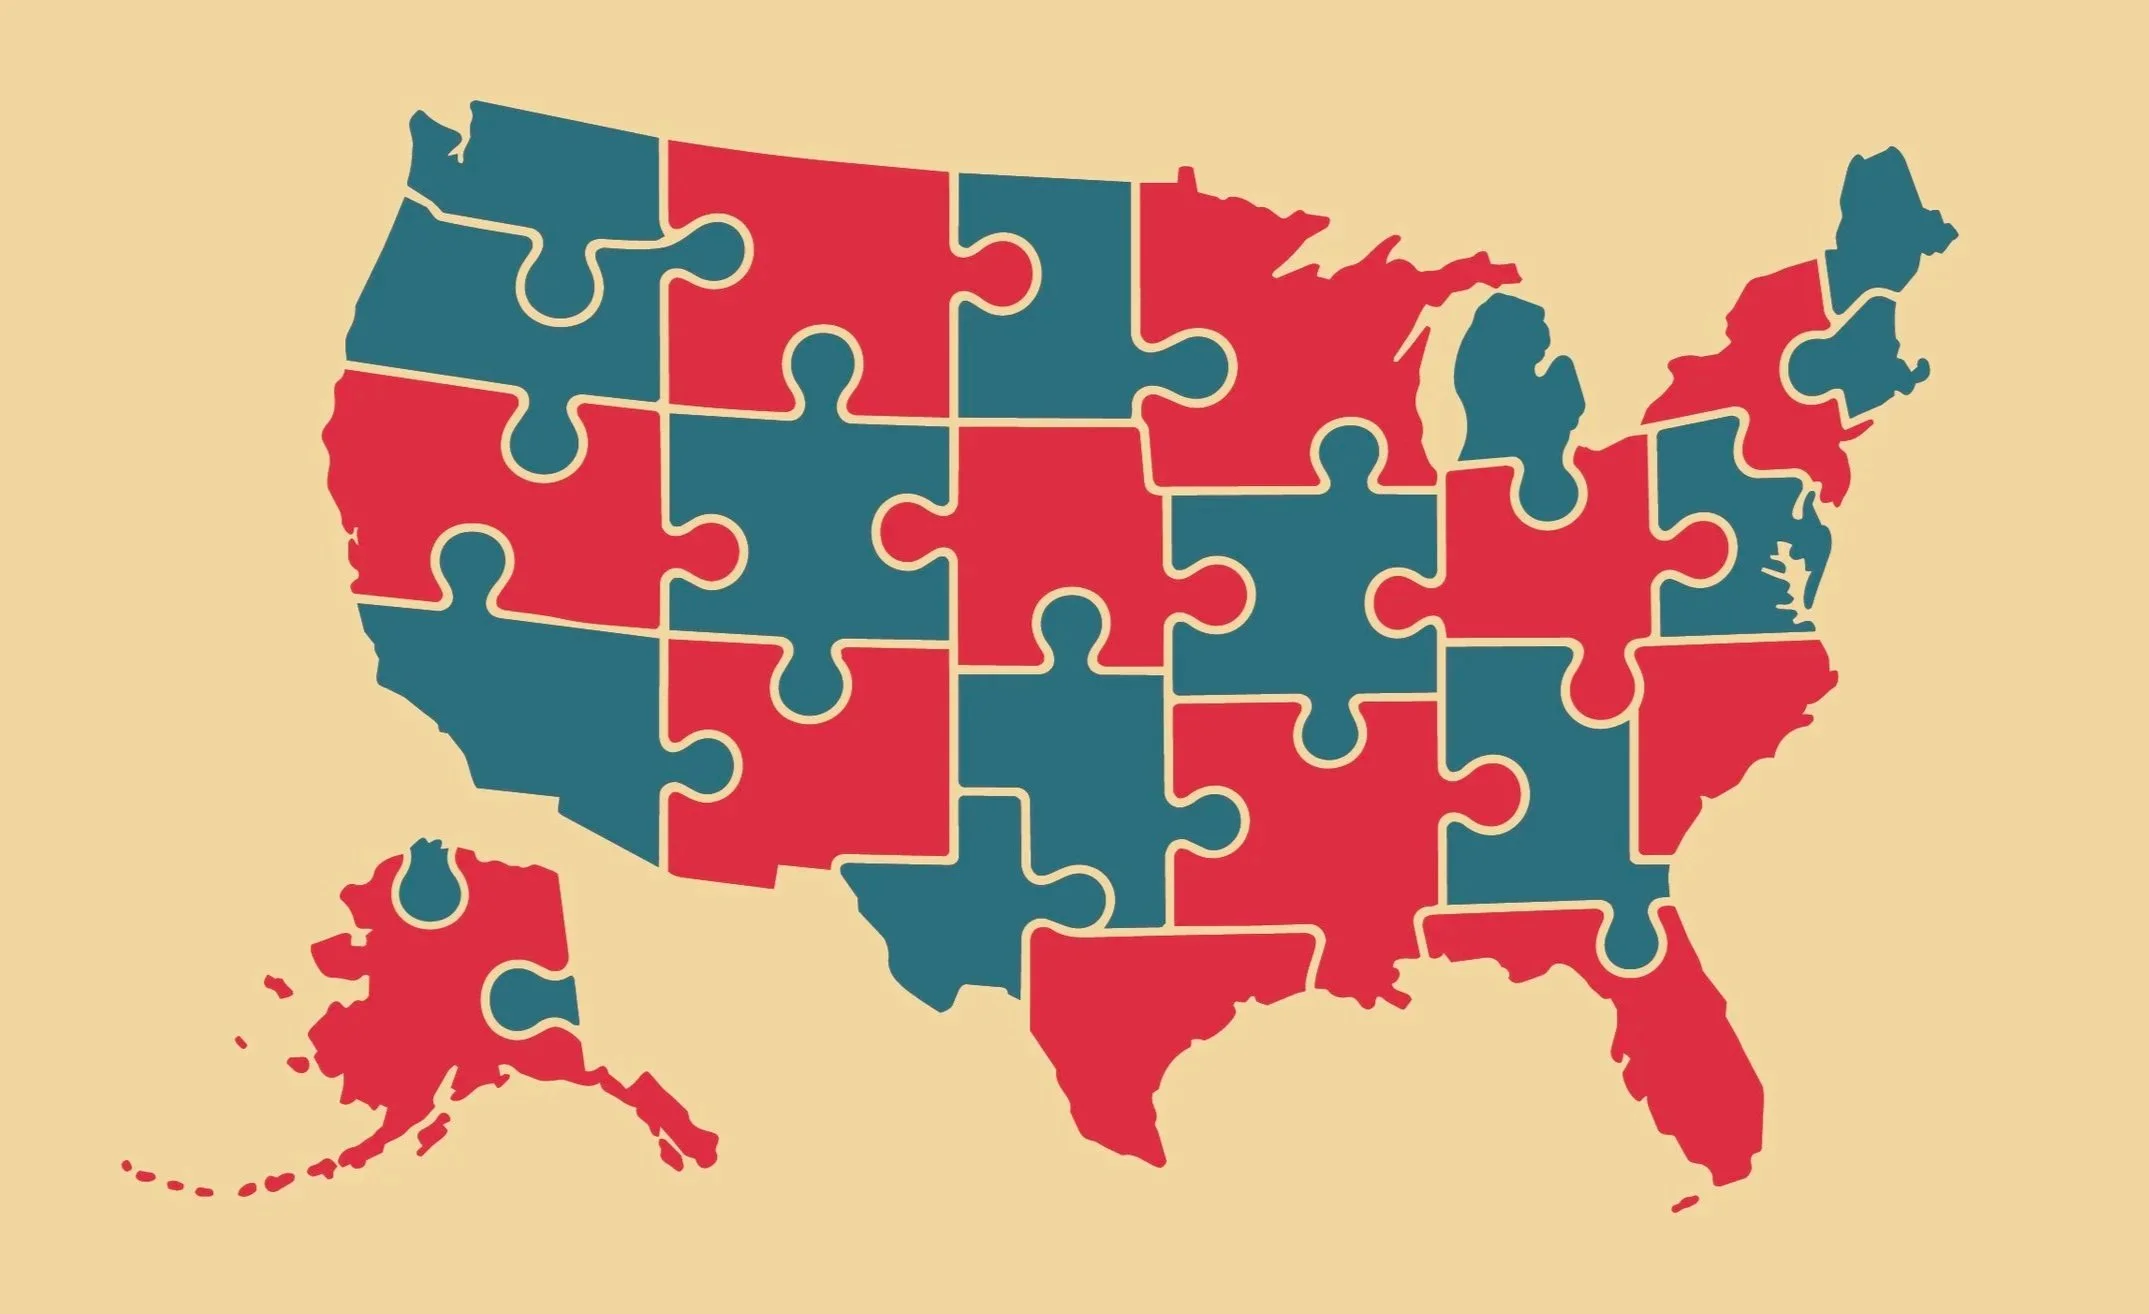
The 2026 midterms will determine control of both chambers of Congress. Democrats need 218 House seats—or a net gain of three seats—to take control of the House. And they need 51 Senate seats—or a net gain of four seats—for control of the Senate.
Democrats need to defend vulnerable seats while flipping Republican-held districts in purple states. The path to victory runs through turnout, organizing, and targeted investment in the right places.
6 Target Senate Races
Republicans head into the 2026 midterms with a 53-47 Senate majority. With 35 seats on the ballot this cycle, Democrats need to defend every seat they currently hold while picking up four Republican-held seats. These six states represent the best bets for Democrats in 2026.
alaska
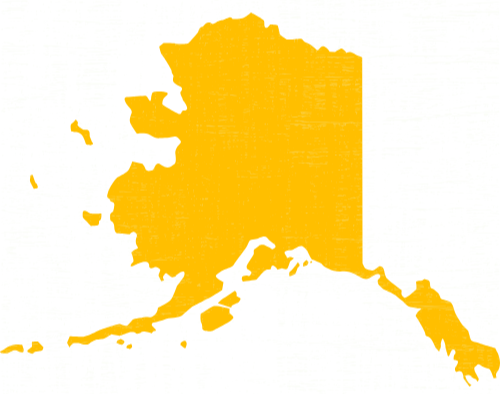
Democratic Nominee: Mary Peltola
The state with the largest Native population is home to a high-profile Senate race featuring a former Democratic Representative who is herself Native and is emphasizing the importance of Alaska’s fishing and energy industries.
iowa
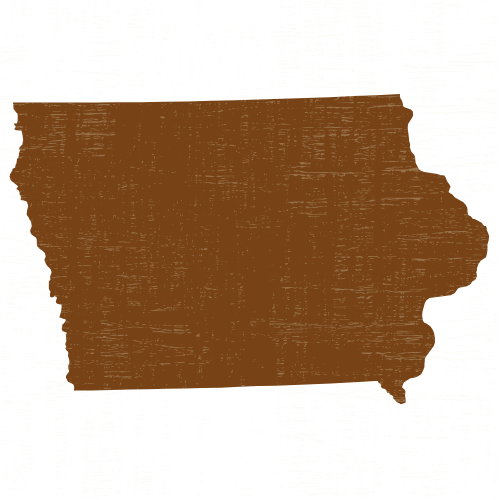
Democratic Nominee: Josh Turek
With Republican Sen. Joni Ernst retiring, the open Senate race has emerged as a closely watched contest, with recent polling showing a relatively narrow margin between the leading candidates.
maine
Democratic Nominee: Troy Jackson
Republican Sen. Susan Collins is seeking another term in a state that has voted Democratic for president since 1988, facing an increasingly difficult reelection fight.
North Carolina
Democratic Nominee: Roy Cooper
Republican Sen. Thom Tillis is retiring, opening an unusually competitive Senate race in a state where the Democratic nominee is the former governor and where Black voters make up 20% of the electorate.
ohio
Democratic Nominee: Sherrod Brown
A former Democratic Senator is running to reclaim his seat from Republican Jon Husted, who was appointed to the Senate in 2025.
Texas
Democratic Nominee: James Talarico
In this minority-majority state, where Latinos make up 32% of its eligible-voter population, sustained investment in voters of color could help push Texas closer to blue.
23 Target House races
Race has historically been one of the most predictive data points about partisan political behavior. Yet national political analysts do not incorporate racial demographic data into their election ratings. This playbook uses the New American Majority Index (NMI)* to surface which districts Democrats have the highest chances of winning and should prioritize.
Democrats are just three net-gained seats away from taking back the House, where Republicans currently hold a narrow majority. Based on our calculations, using the NMI, the below 23 districts represent Democrats’ best opportunities to pick up House seats in 2026. (Click on each district to learn more.)
A majority-POC electorate in California's Central Valley.
A majority-POC electorate spanning Riverside County and northern San Diego County, including the Inland Empire and communities such as Temecula, Escondido and San Marcos.
One of the most heavily POC districts on the list, stretching from the Rio Grande Valley northeast through rural South Texas toward the Corpus Christi area.
A highly diverse electorate across Northern Colorado, including parts of the Denver metro area and Greeley.
A diverse Lower Hudson Valley electorate including Rockland, Putnam and northern Westchester counties.
A diverse electorate centered in the Omaha metropolitan area.
A competitive Southern Arizona district with a sizable POC electorate, including Tucson and surrounding communities.
Nearly four in ten voting-age residents are people of color in this Southeastern Virginia district, including Virginia Beach and the Eastern Shore.
A diverse suburban and exurban electorate spanning northwestern New Jersey, including parts of Morris, Somerset and Union counties.
A Phoenix-area district shaped by demographic change across the Phoenix metropolitan area.
A diverse electorate in the Lehigh Valley and surrounding areas.
A closely contested Lansing-area district in Central Michigan, including Lansing and surrounding areas.
A diverse electorate stretching across Eastern Virginia, including the Northern Neck and parts of the Fredericksburg area.
One in four voting-age residents are people of color in this south-central Pennsylvania district, including the Harrisburg area.
A competitive Des Moines-area electorate spanning the Des Moines metropolitan area and surrounding central Iowa.
A diverse electorate in southwestern Michigan, including Kalamazoo, Holland and Benton Harbor.
A diverse Detroit-area electorate spanning the northern Detroit suburbs and the Thumb region.
A diverse electorate in northeastern Pennsylvania, including Scranton and Wilkes-Barre.
A competitive eastern Iowa district spanning southeastern and south-central Iowa. The 2024 race was decided by a very narrow margin.
A smaller but growing POC electorate across Southwestern and Western Wisconsin. This district was closely contested in 2024.
A Western North Carolina electorate with a meaningful POC presence, including Asheville and surrounding areas. The 2024 election was a close contest here.
A growing share of voters of color in northeastern and east-central Iowa. In 2024, this race came down to a narrow margin.
A diverse electorate in Northeast Ohio, including much of the Greater Cleveland suburbs. This race features a particularly weak Republican candidate.
*Many other political data analysis entities and analysts aggregate polling data into statistical models and forecasts. However, the New American Majority Index (NMI) does not use polls since they are dependent on an individual pollster’s highly subjective determination of which people are likely to vote in a given election, among other reasons. This “Likely Voter” lens completely misses efforts to change the composition of the voting pool by organizing and mobilizing infrequent voters.
The Cook Political Report has developed a Partisan Voter Index (PVI) that uses past presidential election results in a given district and compares that number to the national results of the presidential vote. PVI is a useful metric but it relies on actual election results and doesn’t show the full picture of the partisan leanings of the eligible but non-voting adult citizens in a congressional district.
The NMI goes beyond PVI and adds two additional key data points:
• The full racial diversity of each individual congressional district, and
• The voter turnout rates of each racial group in that district.
Best Bang for your Buck
We crunched the numbers on where best to send your donations. These are the on-the-ground organizations doing the hard work of registering, educating, and turning out voters in priority districts. Nearly every dollar you contribute goes directly to field operations. Click an organization below to learn more. Or click the donate button where your support will be evenly distributed between each organization.